From SDRs to Renewals
Executive Summary
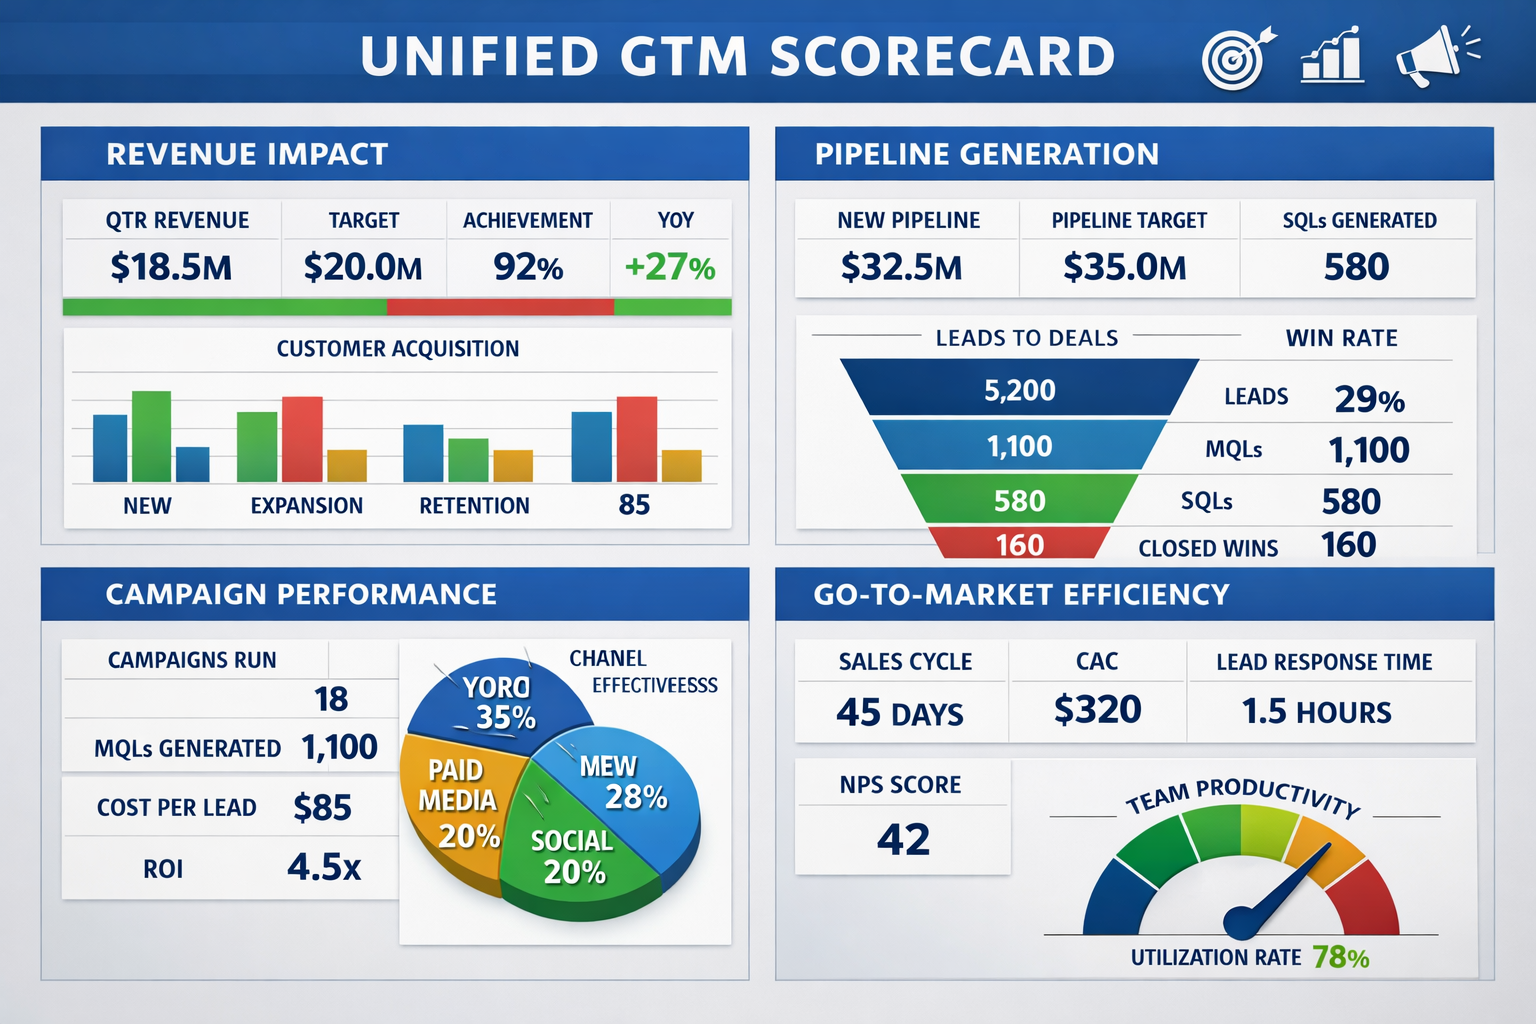
Most GTM teams suffer from metric fragmentation: SDRs optimize for meetings, AEs for bookings, CS for NRR—while leadership tries to reconcile disconnected dashboards into a single growth narrative. A Unified GTM Scorecard solves this by aligning every GTM role to a shared revenue model, causal metrics, and clear accountability from first touch to renewal.
This guide lays out a practical, RevOps-driven framework to design a scorecard that:
- Aligns Marketing, Sales, CS, and Finance around the same revenue outcomes
- Balances leading and lagging indicators
- Scales from frontline execution to board-level reporting
- Prevents metric gaming and KPI overload
The Core Problem: Disconnected Metrics, Misaligned Behavior
| Function | What They Track | What Breaks |
| SDR | Meetings booked | Low-quality pipeline |
| Sales | Bookings | Over-discounting, churn risk |
| CS | NRR | Reactive growth motions |
| Finance | Forecast | Lagging visibility |
The result: Everyone hits their numbers—yet revenue misses plan.
Principles of a Unified GTM Scorecard
-
One Revenue Model, Many Roles
Every metric must map back to one of four revenue levers:
- Pipeline Creation
- Conversion & Velocity
- Retention & Expansion
- Efficiency & Predictability
-
Leading → Lagging Metric Chains
Each role owns controllable leading indicators that roll up into executive lagging outcomes.
- Fewer Metrics, Stronger Accountability
- 5–7 metrics per role
- Clear owner per metric
- Clear decision tied to each KPI
The GTM Scorecard Architecture
Layer 1: Executive North Star Metrics
(Board / C-Suite)
- ARR Growth
- Net Revenue Retention (NRR)
- CAC: LTV
- Forecast Accuracy
- Rule of 40 (where applicable)
Layer 2: Functional Scorecards
SDR / BDR Scorecard
| Metric | Why It Matters |
| Qualified Pipeline Created | Revenue impact, not activity |
| Meeting-to-Opportunity Rate | Quality control |
| Speed-to-Lead | Conversion lift |
| ICP Coverage % | Focus discipline |
| Pipeline SLA Compliance | GTM alignment |
Account Executive Scorecard
| Metric | Why It Matters |
| Win Rate | Sales effectiveness |
| ACV | Deal quality |
| Sales Cycle Length | Velocity |
| Discount Rate | Margin protection |
| Forecast Commit Accuracy | Predictability |
Customer Success Scorecard
| Metric | Why It Matters |
| Gross Revenue Retention | Churn control |
| Net Revenue Retention | Expansion engine |
| Time-to-Value | Adoption health |
| Expansion Pipeline Coverage | Proactive growth |
| Product Usage Index | Leading churn signal |
Marketing Scorecard
| Metric | Why It Matters |
| ICP Pipeline Contribution | Revenue relevance |
| Cost per Qualified Opportunity | Efficiency |
| Funnel Conversion Rates | Demand quality |
| Content-to-Pipeline Ratio | Asset ROI |
| Campaign Influence on Closed-Won | Attribution clarity |
Layer 3: RevOps & Finance Control Metrics
(Integrity & Scalability)
- Data completeness by stage
- Stage aging compliance
- CRM hygiene score
- Capacity model accuracy
- Pipeline coverage by segment
How to Implement (Without Creating KPI Chaos)
Step 1: Map Metrics to Decisions
If a metric doesn’t change behavior, remove it.
Step 2: Standardize Definitions
- What counts as “Qualified”?
- What defines “Expansion”?
Step 3: Automate the Scorecard
- Single dashboard view
- Weekly frontline cadence
- Monthly exec review
Step 4: Tie to Compensation Carefully
- Incentivize outcomes, not vanity activity
- Use scorecards as inputs, not blunt quota replacements
Common Failure Modes (and How to Avoid Them)
| Failure | Fix |
| Too many KPIs | Enforce metric budgets |
| Conflicting incentives | Align to the revenue model. |
| Lag-only reporting | Add leading indicators |
| Static dashboards | Quarterly metric reviews |
Why This Matters Now
As AI, automation, and RevOps mature, the competitive advantage isn’t more data—it’s an aligned signal. Companies that win will be those where every GTM role can answer one question:
How does my work today show up in revenue tomorrow?
A Unified GTM Scorecard makes that answer visible.
Leave a Reply