The RevOps Forensics Approach
Why growth stalls—and how RevOps can uncover the hidden leaks killing revenue
Most revenue teams don’t have a demand problem.
They have a leakage problem.
Leads are generated. Deals are created. Forecasts look reasonable.
Yet somehow, revenue underperforms expectations quarter after quarter.
This is where RevOps Forensics comes in.
Unlike traditional funnel analysis—which focuses on volume and conversion—Lead-to-Revenue Leakage Analysis treats the GTM engine like a crime scene. The goal isn’t reporting. It’s an investigation.
Where did the revenue disappear?
Who (or what) was responsible?
And how do we prevent it from happening again?
What Is Lead-to-Revenue Leakage?
Lead-to-Revenue Leakage is the cumulative revenue loss caused by breakdowns across the GTM lifecycle—from first touch to closed-won (and beyond).
Unlike apparent failures (e.g., low pipeline), leakage is subtle:
- Leads exist, but haven’t worked
- Opportunities stall silently
- Deals close smaller than expected
- Revenue churns faster than modeled
Individually, these issues seem minor.
Collectively, they can erase 20–40% of potential revenue without triggering alarms.
Why Traditional Funnel Metrics Fail to Catch Leakage
Most dashboards answer “What happened?”
Forensics answers “Why did it happen—and where?”
Traditional metrics fall short because they:
- Aggregate away failure signals
- Ignore time-based decay
- Treat all leads and opportunities as equal
- Stop analysis at closed-won (not realized revenue)
RevOps Forensics applies diagnostic thinking, not descriptive reporting.
The RevOps Forensics Framework
A Systematic Investigation of Revenue Loss
Think of this as a five-stage forensic investigation that maps directly to the GTM lifecycle.
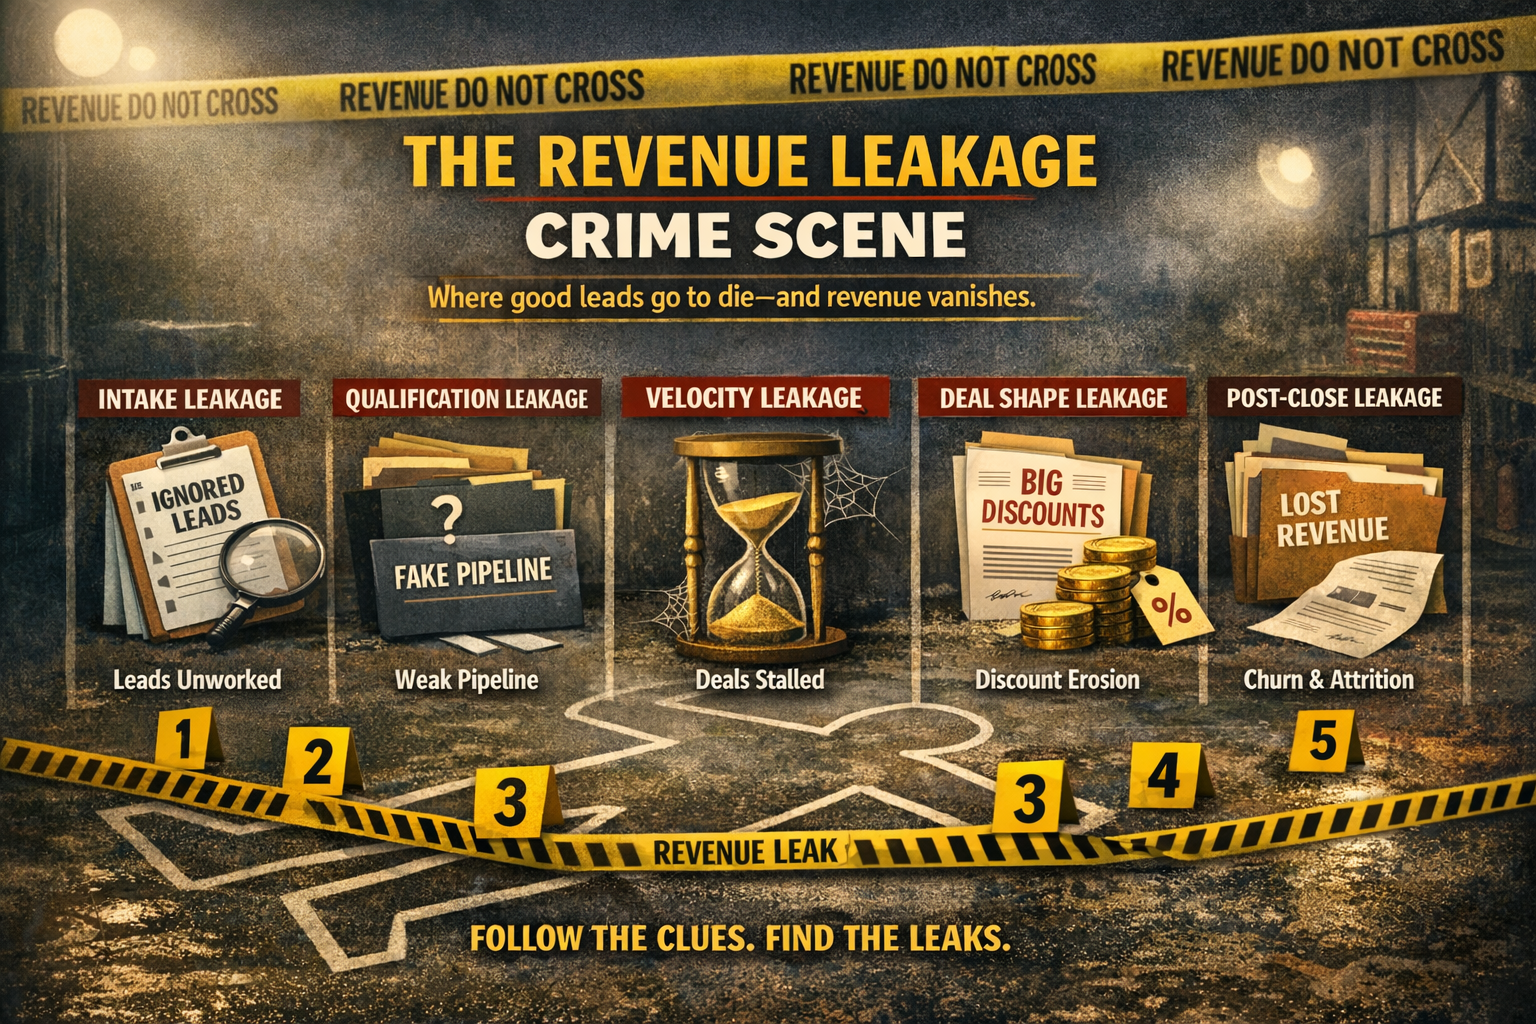
- Intake Leakage: Leads That Never Had a Chance
Symptoms
- High lead volume, low SAL/SQL rates
- “Bad leads” blamed on marketing
- SDR activity is inconsistent or delayed
Forensic Questions
- How long do leads sit before first touch?
- What % never receive any activity?
- Are routing rules introducing silent delays?
Common Leakage Sources
- Broken or slow lead routing
- No SLA enforcement
- Over-scoring vanity leads
- SDR capacity mismatches
Key Metric
Revenue at Risk = Unworked Leads × Historical Lead-to-Revenue Conversion
This is usually the first—and largest—crime scene.
- Qualification Leakage: The Illusion of Pipeline
Symptoms
- High SQL counts, low win rates
- Forecast confidence drops late in the quarter
- Reps “check the box” on qualification
Forensic Questions
- Which qualification fields are auto-filled or ignored?
- How often does MEDDICC/BANT change after stage entry?
- Are deals entering the pipeline without real buyer intent?
Common Leakage Sources
- Weak qualification enforcement
- Incentives tied to stage progression, not deal quality
- CRM fields that exist but aren’t trusted
Key Metric
Pipeline Quality Ratio = Late-Stage Opportunities ÷ Early-Stage Opportunities
If late-stage volume collapses, qualification is the suspect.
- Velocity Leakage: Deals That Die of Old Age
Symptoms
- Deals stall with no formal loss
- “Pushed” deals dominate forecasts
- Sales cycles expand without explanation
Forensic Questions
- Where does the time-in-stage spike abnormally?
- Which personas correlate with delays?
- Are legal, security, or pricing steps undocumented?
Common Leakage Sources
- No exit criteria by stage
- Undefined handoffs (Sales → Legal → Finance)
- Hidden friction in approvals or pricing
Key Metric
Time-Weighted Revenue Loss = Deal Value × Days Over Benchmark Cycle
Velocity leakage doesn’t show up as churn—it shows up as missed quarters.
- Deal Shape Leakage: Winning the Deal, Losing the Value
Symptoms
- Heavy discounting late in the cycle
- Shrinking ACVs despite a stable pipeline
- One-year deals where a multi-year deal was modeled
Forensic Questions
- When do discounts first appear?
- Which reps, segments, or deal sizes over-discount?
- Are pricing guardrails enforced—or optional?
Common Leakage Sources
- No deal desk or inconsistent approvals
- Poor value articulation
- Compensation plans rewarding bookings over the margin
Key Metric
Value Leakage = (List Price – Closed Price) × Win Rate
This is often the most politically sensitive—but financially material—leak.
- Post-Close Leakage: Revenue That Never Fully Materializes
Symptoms
- High bookings, low net revenue retention
- Early churn or downsell
- Expansion forecasts missed
Forensic Questions
- Do customers achieve time-to-value as promised?
- Were expectations set accurately during sales?
- Is CS inheriting deals they didn’t influence?
Common Leakage Sources
- Misaligned Sales and CS incentives
- Poor handoff documentation
- Selling the future roadmap as a current capability
Key Metric
Revenue Realization Rate = Realized Revenue ÷ Booked Revenue
If Finance prioritizes bookings over cash flow, this leak is active.
The RevOps Forensics Toolkit
To run practical leakage analysis, RevOps needs more than dashboards.
Core Capabilities
- Stage-level time analysis
- SLA tracking and enforcement
- Deal change logs (price, scope, term)
- Attribution beyond first/last touch
- CRM + Finance + CS data alignment
Mindset Shift
RevOps is not a reporting function.
It’s an investigative unit for revenue performance.
From Forensics to Prevention
The goal isn’t to assign blame—it’s to design leak-proof systems.
High-performing RevOps teams:
- Instrument revenue risk, not just outcomes
- Build alerts for decay, not just misses
- Tie compensation to revenue quality
- Treat GTM like a continuously monitored system
Final Thought: Growth Is Often Already There—It’s Just Leaking Out
Most companies don’t need more leads, more reps, or more tools.
They need to stop losing the revenue they have already earned the right to win.
Lead-to-Revenue Leakage Analysis is how RevOps graduates from optimization to true revenue stewardship.
Leave a Reply