In this post, I want to take a deep dive into the key metric that Revenue Operations should report on for a SaaS company. One of your fundamental roles is to keep the score, and this is accomplished by creating, updating, and understanding what the key metric is to track.
In this ever-evolving world, we live in, we face disruption as part of our daily lives, and in the software market we are seeing the willingness of all types of companies to adopt SaaS to deliver their products or services. To survive and thrive in today’s SaaS world companies need to understand the markets they serve, the types and profiles of their target prospects/customers, and what is happening with their potential competitors.
Do you serve B2C, B2B, or a blend of both? Can you describe what your products do for potential customers? If you answered yes to these questions, then can you measure your success, or recognize your failures? With SaaS, it is all about customer acquisition and retaining and maximizing value from your existing customers.
Your scorecard when created and updated with the KPI’s below will provide your executive staff and your CXO’s with the knowledge to decide where and when to invest, in the key areas of your business. In Operations our mantra has always been, Customers, Revenue, and Profits. If you report on these three points and focus on Acquiring Customers, Retaining Customers, and Monetizing Customers. Then the value of these three guideposts will provide the map and help you identify if your company is in good shape, and when and where to invest, as well as when you may need to make changes or modifications in your business model before you expand.
Let us look at the key performance indicators you should measure monthly and quarterly.
Booking Metrics
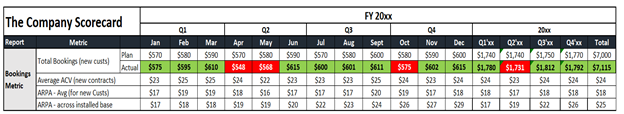
Total Bookings (new customers): This is the Annual Sales Booking Plan. This will include any recurring revenue and professional services and support fees you would sell to a customer (ARR + one-time fees).
Average ACV (new contracts): This is the Annual Contract Value per customer in your booking plan (ACV / net new logos closed in the reporting period).
ARPA – Avg (for New Customers): This is the Average Revenue Per Account, also known as the ARPU where U= Users, ARPC where C = customer. This number only looks at the MRR or QRR or ARR from the new customer order/contract. Some companies may also define this as ASP or Average Selling Price, acronyms are important so be sure to describe ASP as your initial average revenue per customer. (New ARR / Total new logos)
ARPA – Avg (for existing Customers): This is the Average Revenue Per Account, also known as the ARPU where U= Users, ARPC where C = customer. This number only looks at the MRR or QRR or ARR from the existing customer orders/contracts. (note if you report on ARR, then you need to annualize any co-terminus upsells you may have in a customer contract). (Total ARR / total number of accounts).
MRR/QRR/ARR Metrics
To simplify the next section, of your scorecard we will use ARR as our measurement.
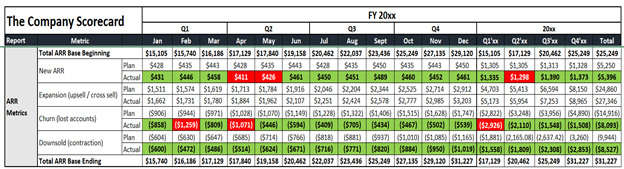
Total ARR Base Beginning: Your total annual ARR value of the existing Customer base. This sums up the value of all existing contracts from the prior period.
New ARR: New ARR added from new customers signed in the month (Total Bookings – one-time charges).
Expansion (upsell/cross-sell): Expansion ARR from the installed base of existing customers.
Churn (lost accounts): Lost ARR from customers who churned (did not renew in the month).
Downsell (contraction existing customers): Lost ARR from customers who reduced ARR YoY, (you can combine the Downsell and Churn for a single number but keeping these separate will allow you to track adoption in your customer base).
Total ARR Base Ending: Your total annual ARR value of the existing Customer base. (ARR beginning + Expansion + Churn + Downsell).
Customer Metrics
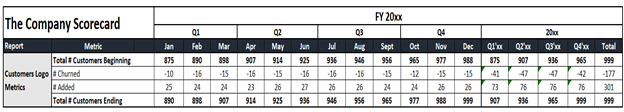
Total # Customers Beginning: Total of all active customers with contracts.
# Churned: Count of ‘Lost’ customers in the reporting period. They did not renew.
# Added: Count of ‘New’ customers won in the reporting period.
Total # Customers Ending: Total ‘Active’ Customers (Beginning + churn + added).
Churn Metrics
This is one of the most crucial factors you will track for your SaaS company. Knowing, understanding, and reacting to Customer retention will increase a customers’ lifetime value and boosts the company’s revenue stream.
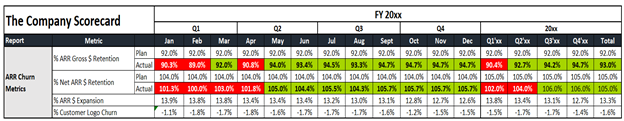
% ARR Gross $ Retention: This is the percentage of recurring revenue retained from existing customers in a defined time period, including down-sells and canceled contracts. It excludes expansion. (ARR up for Renewal – Downsell – Churn) / ARR up for Renewal).
% Net ARR $ Retention: This is the percentage of recurring revenue retained from existing customers in a defined time period, including expansion revenue, down-sell, and canceled contracts. (ARR up for Renewal + Downsell + Churn + Expansion) / ARR up for Renewal.
% ARR $ Expansion Net Retention Rate ($): Revenue % Growth from Customer Base (ARR Base Beginning + Expansion – Downsell – Churn) / ARR Base Beginning).
% Customer Logo Churn: Percent of Lost Customers in the reporting period (# Churned / Total # Customers Beginning).
Customer ROI
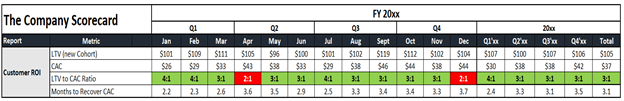
LTV (new cohort): This metric is as important to track! The LTV or CLTV metric shows the total revenue your company could expect from this cohort of customers. It evaluates the cohort’s revenue value, and the company’s churn and compares that number to the predicted customer lifespan. (New ARPA * Expected Customer Lifespan x 1- % Customer Logo Churn).
CAC: Your CAC or Customer Acquisition Cost is the fully loaded Marketing and Sales expense associated with the new customer cohort acquisition cost. (Sales & Marketing expense / # of new Customers)
LTV to CAC Ratio: This measures your cost to get a new Customer vs. the customer lifetime value, or your ROI for each dollar spent. If you are between 3:1 to 4:1 you are seeing the expected ROI, but if you are 5:1 or greater you are underspending in sales and/or marketing and slowing potential growth. (LTV/CAC)
Months to Recover CAC: This is the combination of your CAC and ARR and Gross Margin. This KPI shows efficiency in new customer acquisition, as well as your company’s ability to monetize the customer. Your goal is to have this payback period be less than 12 months. (CAC / (ARPA Ave new Custs x GM%)
Financial Metrics
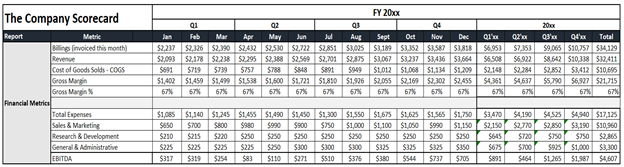
Billings (invoiced this month): Customers may be billed in advance of when revenue can be recognized.
Revenue: Revenue is typically recognized monthly except for one-time fees which will vary based on accounting standards, so may not match Billings.
Cost of Goods Sold – COGS: Cost of goods sold (COGS) refers to the direct costs of producing the goods sold. This amount includes the cost of the materials and labor directly used to create the goods or services.
Gross Margin: Revenue – COGS in dollars.
Gross Margin %: Gross Margin dollars / Revenue.
Total Expenses: Sum of Sales, Marketing R&D, and G&A.
Sales & Marketing: The expense incurred by the company, directly allocable to sales, promotion, and marketing of a Product.
Research & Development: The amount of money that a company spends to develop new products and services each year.
General & Administrative: Any cost that does not link to R&D or S&M is classified as a general and administrative expense; this excludes COGS.
EBITDA: EBITDA is net income (or earnings) with interest, taxes, depreciation, and amortization added back. Based on GAAP (Data should be provided by Finance).
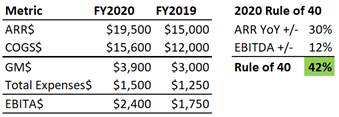
Special note: If you are generating $1m in MRR you should include “The Rule of 40” in your monthly metric reports. Below is an example of how you would show this in a scorecard.
The earlier section looked at the overall financial aspects of the business, but your scorecard should track your high-level Marketing, Sales, and Customer Success metrics as well.
Marketing Funnel Metrics
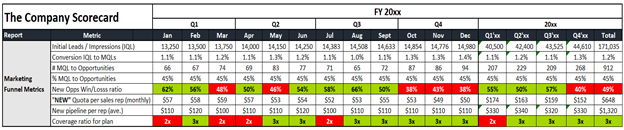
Initial Leads / Impressions (IQL): Total number of ‘Initial Qualified Leads’ IQLs.
Conversion IQL to MQLs: The total percent of IQL’s converted to MQL’s.
# MQL to Opportunities: The count of MQL’s that have converted to Sales Opportunities.
% MQL to Opportunities: The percentage of MQL’s that have converted to Sales Opportunities.
New Opps Win/Loss ratio: The percentage of New sales ops / closed-won opps.
“NEW” Quota per sales rep (monthly): # of FTE reps x quota (should translate into New ARR Bookings)
New pipeline per rep (ave.): Value of current pipeline a Sales Rep has qualified.
The coverage ratio for the plan: Measures the ratio between the dollar value reps funnel vs revenue targets. ex: coverage 3x means the total pipeline is three times quota. In this case, you need to close 33% of the pipeline to meet the sales goal.
Sales Metrics
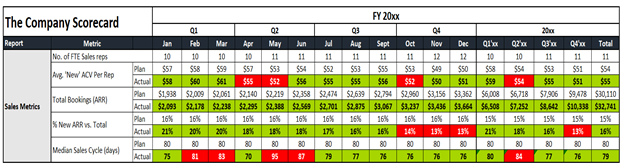
No. of FTE Sales reps: FTE = Full-Time Equivalent (equivalent # of fully productive reps).
Avg. ‘New’ ACV Per Rep: New ARR + Expansion ARR / FTE.
Total Bookings (ARR): New ARR + Expansion ARR.
% New ARR vs. Total: New Customer ARR Plan / New Customer ARR plan + Expansion.
Median Sales Cycle (days): length time (in days) of validated opp to closed-won.
Customer Success Metrics:
Customer Engagement Score: The average Customer Engagement Score across the customer base. (you will need to have CS define the CES with inputs such as frequency of usage, depth of usage, specific actions are taken, and key performance indicators). You need to use this to help predict customers that are most likely to churn. Also, this score can provide insights into the features that can lead to upsell/cross-sell.
Net Promoter Score: NPS scores are measured with a single question survey and reported with a number from -100 to +100. The NPS survey is a scale of 1 to 10, where a score of 0-6 = detractors, 7 or 8 = Neutral, and 9 or 10 = Promoter. To calculate ignore 7 and 8, sum the Detractors / total respondents – sum Promoters / total respondents x 100 = NPS Score.
Median days Implement/Go Live: Number of days allotted for Professional Services to deploy new customers: This is important to track the number of days to configure the New Customer account and can help you determine if your Professional Services organization is getting your customer to adopt, leading to higher levels of satisfaction, as well as increased expansion revenue. Also, if this number is not on track it can indicate other possible issues with your product, the tools used to support implementation, or the capabilities of your Services team.
Median hours Per Implementation: Actual total number of hours spent for a new Customer implementation: This measures your Professional Services team’s delivery capabilities to support customer needs.
If you are a mature SaaS company and have a revenue of $12m per year you may want to report on
-
- Number of Support Tickets Created: At a high level, you should track the number of support tickets in a reporting period. You should also have a separate CS dashboard to track the trend of average numbers of daily, weekly, and monthly tickets, as well as creating buckets for these tickets, such as bugs, feature requests, questions, suggestions, and others). This is vital to decide whether there are usability issues, poor adoption, or just requests for expanded or even new capabilities.
- Average First Response Time: Measure the average amount of time it takes for customer support to respond to a case after it is submitted. This can be a precursor to customer satisfaction. If your response is late you can have a higher level of dissatisfaction and less engaged customer.
- Average Resolution Time: The average amount of time it takes your support team to resolve or close a ticket. This measurement is more impactful on retention and satisfaction. If you do not resolve the issue, then it does not matter how soon you respond to the ticket if you do not resolve the ticket.
As a Revenue Operations professional, your team supports the business across the full customer life cycle to drive growth through operational efficiency and keep all teams accountable to revenue. It is important t note that reporting these metrics will not change anything. These KPIs are only a tool to provide a view and insight into your business. With this data, your Executive team can make more informed decisions about the direction to take the Company. If you would like to see the full Scorecard you can find it here
Remember Revenue Operations is like the lighthouse “A symbol of presence, safety, and navigational guides. They also represent guidance, illumination, never-ceasing watchfulness, steadfast endurance, and helpfulness”.
Recommended Blogs to read and follow:
Leave a Reply