Introduction: Why KPIs Need Structure
Revenue Operations (RevOps) exists to bring coherence to chaos — aligning sales, marketing, and customer success around shared revenue outcomes.
But too often, RevOps leaders drown in metrics without a framework. Teams measure everything but understand nothing.
Enter the RevOps KPI Pyramid — a hierarchy of metrics that connect tactical execution (what happens in the funnel) to strategic growth outcomes (how efficiently you scale).
This model ensures every dashboard, every OKR, and every operational decision ladders up to revenue efficiency and customer lifetime value.
The KPI Pyramid Framework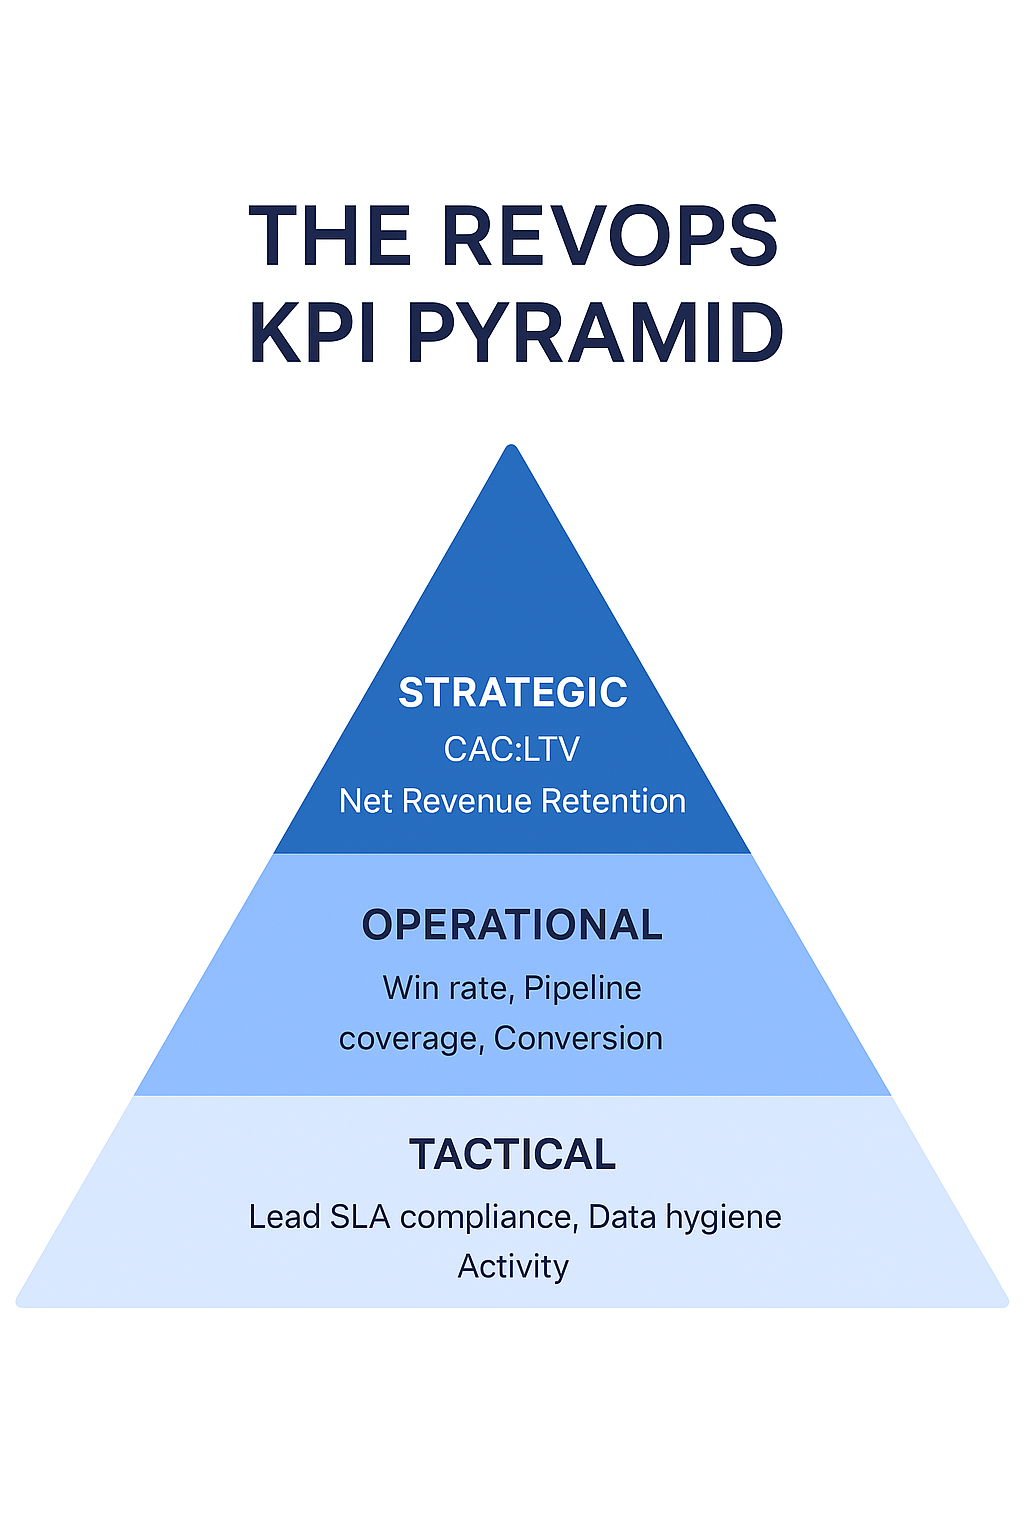
The RevOps KPI Pyramid is divided into three tiers — each with its own time horizon, purpose, and audience.
| Level | Focus | Time Horizon | Audience |
| Strategic | Long-term revenue efficiency and growth health | Quarterly–Annually | Executive leadership, investors |
| Operational | Funnel performance and GTM execution | Monthly–Quarterly | GTM leadership (Sales, Marketing, CS) |
| Tactical | Daily/weekly process compliance and productivity | Daily–Weekly | Frontline managers, RevOps analysts |
- Tactical Metrics (The Base of the Pyramid)
These are the leading indicators — the data points RevOps tracks daily or weekly to keep the GTM machine running smoothly.
Purpose:
Monitor activity health and process adherence.
Examples:
- Lead SLA Compliance: % of inbound leads contacted within the defined time.
- Data Hygiene: % of complete CRM records (no missing phone/email/title).
- Meeting-to-Opportunity Conversion Rate
- Outbound Sequence Completion Rate
- Pipeline Hygiene: % of opportunities updated in the past 14 days.
- Quote-to-Close Velocity: Avg. days from quote sent to deal won.
Tools & Automation:
- Salesforce dashboards or Gong insights
- Automated alerts in Slack (e.g., “Lead not touched in 24 hours”)
- RevOps workflow tools like LeanData, HubSpot Ops Hub, or Clari
RevOps Tip: Tactical metrics are “smoke detectors.” They don’t tell you why revenue is off, but they tell you where to look.
2. Operational Metrics (The Middle Tier)
Operational metrics measure the efficiency of your go-to-market engine.
They bridge the gap between daily execution and strategic outcomes.
Purpose:
Track funnel health and GTM performance across teams.
Examples:
- Marketing → Sales Handoff Rate
- Lead-to-Opportunity Conversion Rate
- Pipeline Coverage Ratio (per segment)
- Win Rate (%)
- Sales Cycle Length
- Customer Onboarding Time
- Renewal Rate (%)
Tools & Automation:
- Funnel reports in Salesforce or HubSpot
- Attribution tools (e.g., Bizible, Dreamdata)
- CS tools like Gainsight or Vitally for renewal health
RevOps Tip: Operational metrics should map to OKRs and be reviewed cross-functionally. Marketing, Sales, and CS all own parts of the same funnel.
3. Strategic Metrics (The Apex of the Pyramid)
These are the ultimate outcomes — the KPIs that determine whether your GTM model is sustainable and scalable.
Purpose:
Evaluate revenue efficiency and long-term value creation.
Examples:
- CAC (Customer Acquisition Cost)
- LTV (Customer Lifetime Value)
- CAC: LTV Ratio
- Net Revenue Retention (NRR)
- Gross Revenue Retention (GRR)
- Rule of 40 (for SaaS)
- Revenue per Employee
- Sales Efficiency (New ARR / Sales & Marketing Spend)
Tools & Automation:
- Finance & BI platforms (e.g., Tableau, Power BI, Pigment, Cube)
- FP&A integrations (e.g., SaaSOptics, Mosaic, or Anaplan)
- Predictive analytics in RevOps dashboards
RevOps Tip: Strategic metrics define the true north — your ability to generate, retain, and expand revenue efficiently. They’re not just lagging indicators; they guide budget allocation, hiring, and forecasting.
How the Pyramid Connects
Visualize it like this:
▲
Strategic
(CAC: LTV, NRR, Rule of 40)
│
Operational
(Win Rate, Pipeline, Conversion)
│
Tactical
(Lead SLA, Data Hygiene, Activity)
The pyramid works top-down and bottom-up:
- Strategic goals define what success looks like.
- Operational metrics diagnose efficiency gaps.
- Tactical metrics ensure executional discipline.
When all three levels align, your RevOps function becomes the source of truth for business performance — not just reporting data, but driving outcomes.
Building a RevOps KPI Scorecard
A KPI Scorecard makes the pyramid actionable. It connects the dots between what teams do daily and how the company grows.
Here’s a practical example you can copy into Excel or Google Sheets:
RevOps KPI Scorecard Template
| Funnel Stage | Tactical Metrics (Daily/Weekly) | Operational Metrics (Monthly) | Strategic Metrics (Quarterly) | Target / Goal | Owner |
| Top of Funnel (Marketing) | Lead SLA Compliance %, MQL Volume, Form Fill Conversion Rate | Lead-to-Opportunity Conversion %, Cost per MQL | CAC, Pipeline Coverage | SLA ≥ 95%, Conversion ≥ 10% | Marketing Ops |
| Middle Funnel (Sales) | Opportunity Hygiene %, Activity-to-Meeting Ratio | Win Rate, Sales Cycle Length, Forecast Accuracy | CAC: LTV, Sales Efficiency | Win Rate ≥ 25%, Cycle ≤ 45 days | Sales Ops |
| Bottom Funnel (Customer Success) | Renewal Task Completion %, Health Score Update Rate | Onboarding Completion %, Churn %, Expansion Rate | NRR, GRR, LTV | NRR ≥ 120%, GRR ≥ 90% | CS Ops |
| Finance Alignment | Quote Accuracy %, Deal Desk SLA | Billing Accuracy %, Revenue Recognition Timing | Rule of 40, Gross Margin % | Margin ≥ 75% | Finance / RevOps |
| Overall RevOps Health | Data Completeness %, Tool Adoption %, SLA Compliance | Funnel Velocity, Forecast Variance | CAC: LTV, Revenue Efficiency | CAC: LTV ≥ 3:1 | RevOps |
How to Operationalize the Pyramid
- Start Bottom-Up:
Standardize data and process compliance first—automate tactical metrics. - Build Dashboards that Ladder Up:
Create rollup dashboards that show how tactical improvements influence strategic outcomes. - Review by Cadence:
- Weekly: Tactical health
- Monthly: Operational efficiency
- Quarterly: Strategic growth
- Tie Metrics to OKRs:
Example: “Increase NRR to 125% by improving expansion conversion rate from 15% → 20%.” - Evolve the Model:
As your GTM matures, the pyramid shifts. Early-stage companies focus on acquisition metrics; mature orgs concentrate on retention and efficiency.
Conclusion: Turning Metrics into Momentum
The RevOps KPI Pyramid transforms KPIs from noise into narrative.
It gives every stakeholder — from SDRs to CFOs — a shared understanding of what drives growth, efficiency, and sustainability.
In RevOps, clarity equals power.
When your metrics align across the pyramid, your GTM teams align across the business.
Leave a Reply