Why Every Process Degrades Over Time
The Inevitable Truth: Your RevOps System Is Decaying
In physics, entropy is the natural tendency of systems to move from order to disorder.
In Revenue Operations?
Entropy is the silent force turning your clean, efficient GTM machine into a tangled mess of friction, delays, and missed revenue.
No matter how well-designed your:
- Lead routing logic
- Pipeline stages
- Forecasting models
- Sales playbooks
They will degrade over time.
Not because your team is incompetent.
Not because your strategy is flawed.
But all operational systems drift toward chaos unless actively maintained.
What Entropy Looks Like in RevOps
Entropy doesn’t show up all at once. It creeps in—quietly, then suddenly.
-
Process Drift
Your original process was tight:
- Clear stage definitions
- Exit criteria enforced
- Clean handoffs
Six months later:
- Reps skip stages
- Exit criteria become “optional.”
- Handoffs happen via Slack instead of systems
Result: Pipeline becomes narrative, not data.
-
Field & Data Sprawl
What started as a clean CRM becomes:
- 400+ fields
- Duplicate objects
- Conflicting definitions (What is SQL anymore?)
Result: Reporting becomes political instead of factual.
-
Workflow Creep
Automation was supposed to simplify.
Instead:
- Overlapping workflows
- Broken triggers
- Recursive automations
Result: No one trusts what the system is doing.
-
Exception Culture
Every “one-off” exception gets baked in:
- Special pricing paths
- Custom approval flows
- Unique routing rules
Result: The system now serves edge cases instead of the majority.
-
Forecast Degradation
Forecasting starts precisely:
- Stage-based probabilities
- Defined deal inspection
Over time:
- Gut feel replaces rigor
- Stages lose meaning
- Sandbagging creeps in
Result: Forecast = theater.
The RevOps Entropy Curve
Imagine this:
- Day 0: High efficiency, low friction
- Month 3: Minor deviations
- Month 6: Noticeable inconsistencies
- Month 12: System no longer reflects reality
Without intervention, efficiency doesn’t plateau—it declines.
The Core Drivers of RevOps Entropy
-
Organizational Change
- New hires reinterpret processes
- New leaders introduce “improvements.”
- M&A introduces conflicting systems
Every change introduces variance.
-
Speed Over Discipline
Teams prioritize:
- “Closing the deal.”
over - “Following the process.”
Short-term wins create long-term degradation.
-
Lack of System Ownership
When no one owns:
- Process integrity
- Data quality
- Workflow governance
Entropy accelerates.
-
Tool Proliferation
New tools get layered on:
- Sales engagement
- Enrichment
- Forecasting
- AI tools
Without rationalization, the stack becomes fragmented and contradictory.
-
Time (The Biggest Culprit)
Even if nothing changes:
Time alone introduces decay.
- Definitions become outdated
- Markets shift
- Buyer journeys evolve
Your system becomes a fossil of past assumptions.
The Hidden Cost of Entropy
Most companies don’t measure entropy directly.
But they feel it through:
Revenue Leakage
- Deals stall in undefined stages
- Leads fall through cracks
Time Tax
- Reps spend more time navigating systems than selling
Forecast Inaccuracy
- Leadership loses trust in numbers
Rework Loops
- Deals re-enter earlier stages
- Data gets corrected multiple times
Operational Drag
- Every process takes longer than it should
Entropy vs. Revenue Efficiency (RER Lens)
This is where your earlier concept of Revenue Efficiency Rate (RER) becomes powerful.
Entropy is the force working against RER.
Where RER drives:
- Speed
- Throughput
- Signal clarity
Entropy introduces:
- Friction
- Noise
- Delay
You are not just building efficiency.
You are fighting decay.
The Entropy Flywheel (How It Gets Worse)
Entropy compounds:
- Small process deviations
- Lead to bad data
- Which breaks reporting
- Which erodes trust
- Which leads to workarounds
- Which further degrades the system
This is not linear. It’s exponential decay.
How High-Performing RevOps Teams Fight Entropy
The best teams don’t try to eliminate entropy.
They design systems assuming entropy will happen.
-
Process Governance Cadence
Treat your GTM system like a product:
- Monthly: Field & workflow audits
- Quarterly: Process redesign reviews
- Annually: Full GTM architecture reset
If it’s not reviewed, it’s decaying.
-
The “Ruthless Simplification” Rule
For every:
- New field
- New workflow
- New exception
You must remove or consolidate something else.
Complexity is entropy’s fuel.
-
Single Source of Truth Enforcement
- Clear definitions (SQL, stage, pipeline)
- Locked fields where appropriate
- Controlled entry points
Ambiguity accelerates entropy.
-
Exception Budget
Set a limit:
“We allow only X% of deals to follow non-standard paths.”
Beyond that → system redesign is required.
-
Observability Layer
Track:
- Time in stage
- Rework rates
- Field completion rates
- Workflow failure rates
You can’t fix what you can’t see.
-
RevOps as System Owner (Not Support)
RevOps should function like:
👉 Product Management for Revenue Systems
Responsible for:
- Roadmap
- QA
- Adoption
- Performance
Not just:
- Ticket resolution
-
“Process Half-Life” Thinking
Every process has a shelf life.
Ask:
- When was this last validated?
- Does it still reflect buyer behavior?
If not:
It’s already decaying.
The Shift in Mindset
Most companies think:
“We need to build the perfect RevOps system.”
Elite companies think:
“We need to fight entropy continuously.”
That’s a completely different operating model.
A New Operating Model: Entropy-Aware RevOps
Instead of static systems, build:
Adaptive Systems
- Flexible but governed
Measured Systems
- Instrumented for decay signals
Iterative Systems
- Constantly refined
Owned Systems
- Clear accountability
Final Thought: Entropy Is Not the Enemy—Neglect Is
Entropy is natural.
Decay is expected.
Breakdown is predictable.
But failure?
That happens when you ignore it.
The Real Question
It’s not:
“Is your RevOps system degrading?”
It is.
The question is:
How fast—and what are you doing about it?
RevOps Entropy Diagnostic Scorecard
This is where things get powerful—you can actually measure decay.
How to Use
- Score each category 1–5
- 1 = Severe entropy
- 3 = Moderate/manageable
- 5 = High integrity / controlled
Process Integrity (Weight: High)
| Metric | Question | Score (1–5) |
| Stage Discipline | Are stages consistently followed? | |
| Exit Criteria Enforcement | Are the criteria required or bypassed? | |
| Handoff Consistency | Are transitions system-driven or manual? | |
| Process Exceptions | % of deals outside standard flow |
Data Integrity
| Metric | Question | Score |
| Field Completion Rate | Are the required fields actually filled? | |
| Data Accuracy | Do reports match reality? | |
| Definition Consistency | Are terms (SQL, pipeline) aligned? | |
| Duplicate/Noise Level | Is the data clean or cluttered? |
Workflow & Automation Health
| Metric | Question | Score |
| Workflow Reliability | Do automations behave as expected? | |
| Redundancy | Are multiple workflows doing the same thing? | |
| Failure Visibility | Are errors tracked and fixed? | |
| Logic Simplicity | Is automation understandable? |
Forecast Integrity
| Metric | Question | Score |
| Forecast Accuracy | Within ±5–10% consistently? | |
| Stage Confidence | Do stages reflect real-deal health? | |
| Inspection Rigor | Are deals reviewed systematically? | |
| Leadership Trust | Do execs believe the forecast? |
System Complexity (Entropy Multiplier)
| Metric | Question | Score |
| Field Count Creep | Is CRM bloated? | |
| Tool Sprawl | Number of overlapping tools | |
| Exception Volume | How many “special paths”? | |
| Process Variants | How many ways to sell? |
Behavioral Signals (Leading Indicators of Entropy)
| Metric | Question | Score |
| Rep Workarounds | Do reps avoid the system? | |
| Shadow Systems | Use of spreadsheets / Slack tracking | |
| Rework Rate | Deals are moving backward in stages | |
| Time in Stage Variability | Inconsistent cycle times |
Scoring Model
Step 1: Calculate Category Scores
Average each section.
Step 2: Weighted Entropy Score
Example weighting:
- Process: 25%
- Data: 20%
- Workflow: 15%
- Forecast: 20%
- Complexity: 10%
- Behavior: 10%
Final Output: Entropy Index (0–100)
| Score | Interpretation |
| 80–100 | Low Entropy (High Efficiency System) |
| 60–79 | Controlled Entropy (Needs Active Governance) |
| 40–59 | Rising Entropy (Efficiency Erosion Visible) |
| <40 | High Entropy (System Breakdown) |
Bonus: Entropy Red Flags Dashboard
Track these monthly:
- % deals skipping stages
- % fields auto-filled vs manually entered
- Forecast variance
- Workflow error rate
- Avg time in stage (variance, not just mean)
- % deals with exceptions
Final Synthesis
The Diagram Shows:
👉 Where entropy enters
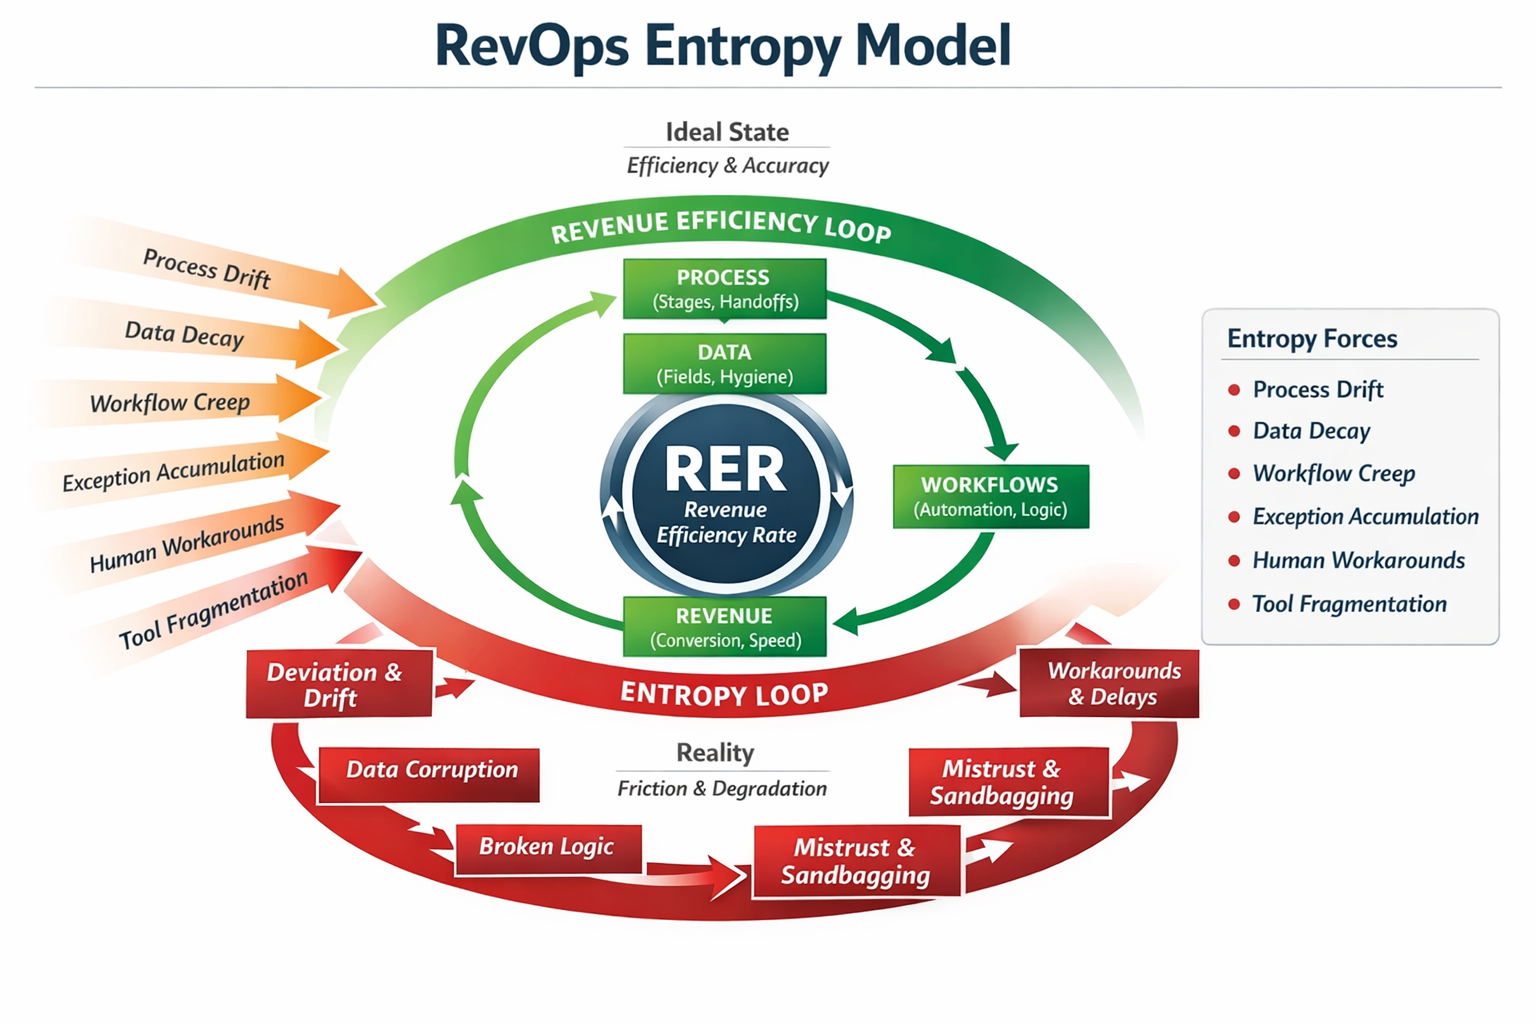
The Scorecard Measures:
👉 How much entropy exists
Together:
👉 You move from intuition → instrumentation